Every week, a new startup or Fortune 500 post goes viral with “We shipped 25% of our code with AI.”
But when you ask, “So what’s the actual business impact?” — things get quiet.
According to DX’s 2025 AI Impact Report (featured in The Pragmatic Engineer), 60% of engineering leaders cite “lack of clear metrics” as their top challenge with AI adoption.
Everyone’s rolling out copilots, but few can answer the simplest ROI question:
“Is AI making us better at what already matters — shipping faster, improving quality, and delighting customers?”
That’s the gap.
And it’s exactly what this post, and the AI ROI Framework — is designed to fix.
🧠 The AI ROI Framework: 3 Layers That Keep You Honest
I’ve seen companies from scrappy startups to enterprise orgs make the same mistake:
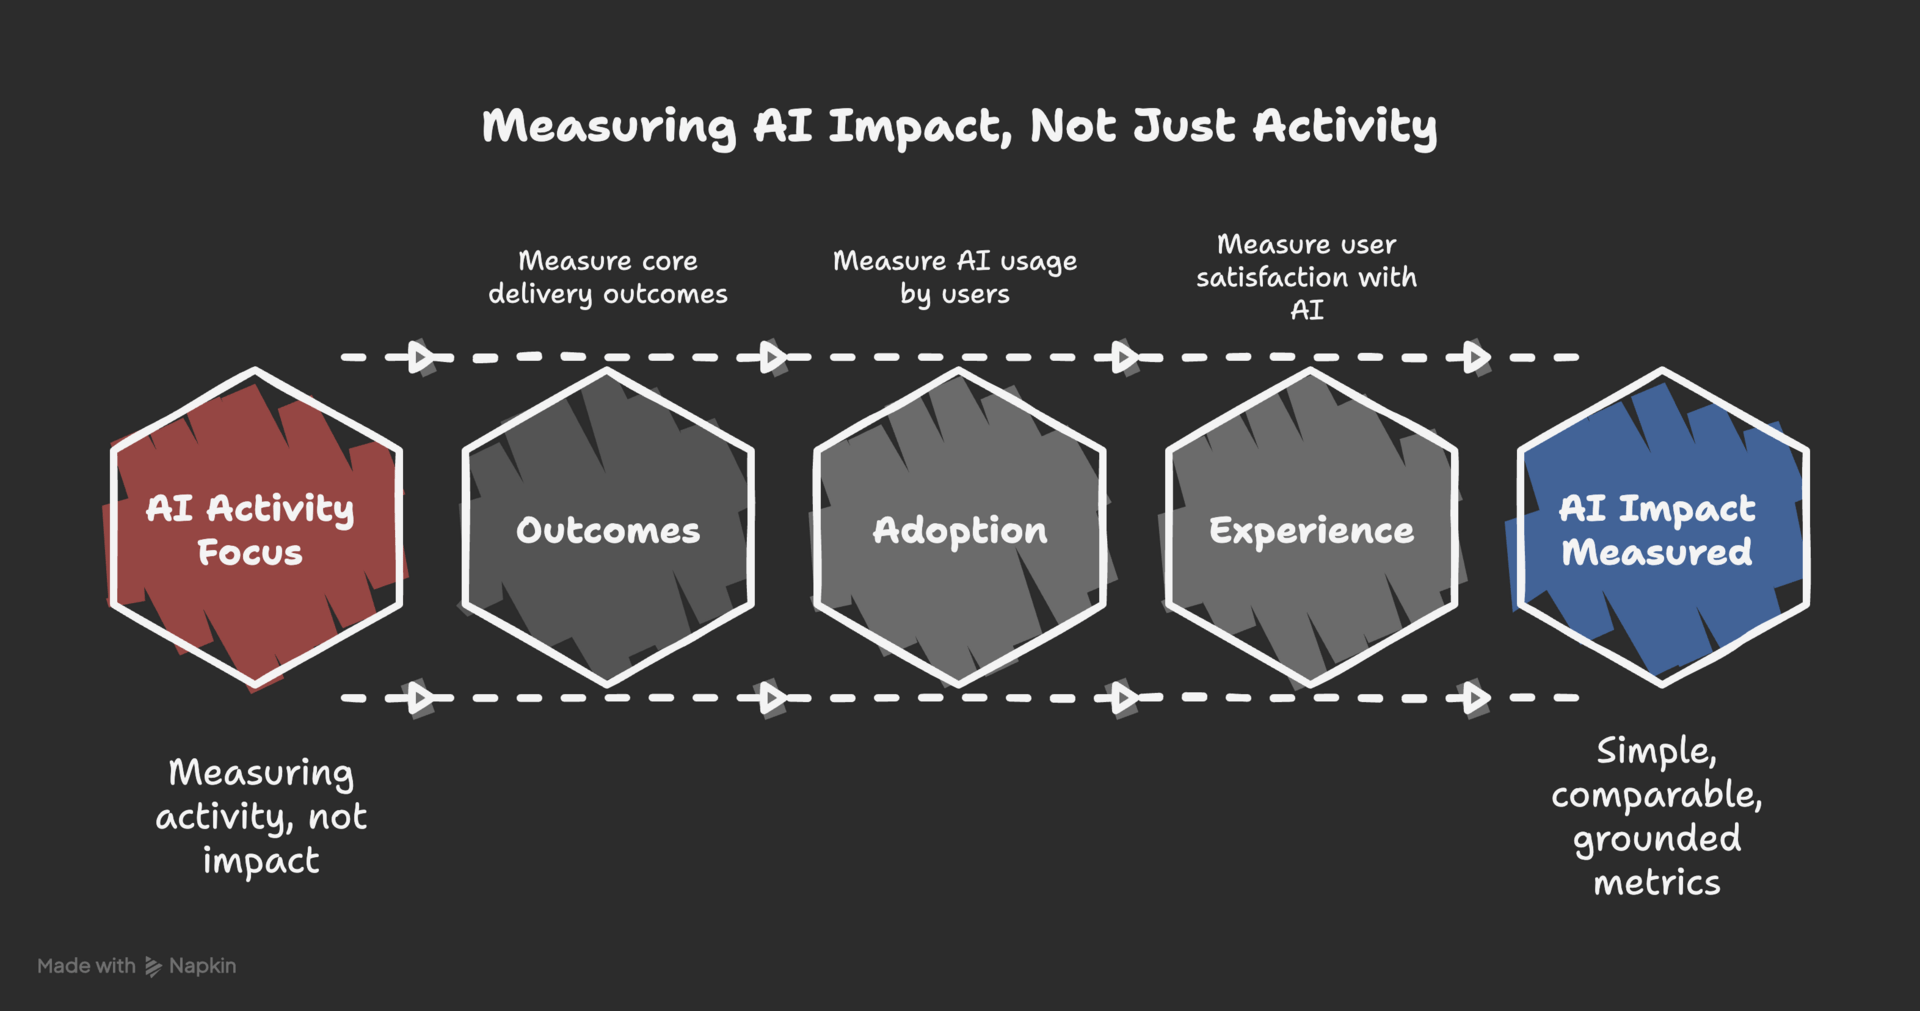
They measure AI activity, not AI impact.
The key is to keep your framework simple, comparable, and grounded in metrics you already track.
You don’t need a PhD or a data team, just a 3-layer structure and a bit of discipline.

Layer 1: Outcomes — The Business Lens
AI success starts with the metrics that matter even without AI.
These are your core delivery outcomes — the heartbeat of any software or process-driven team.
Ask: Did AI move the needle on what already matters?
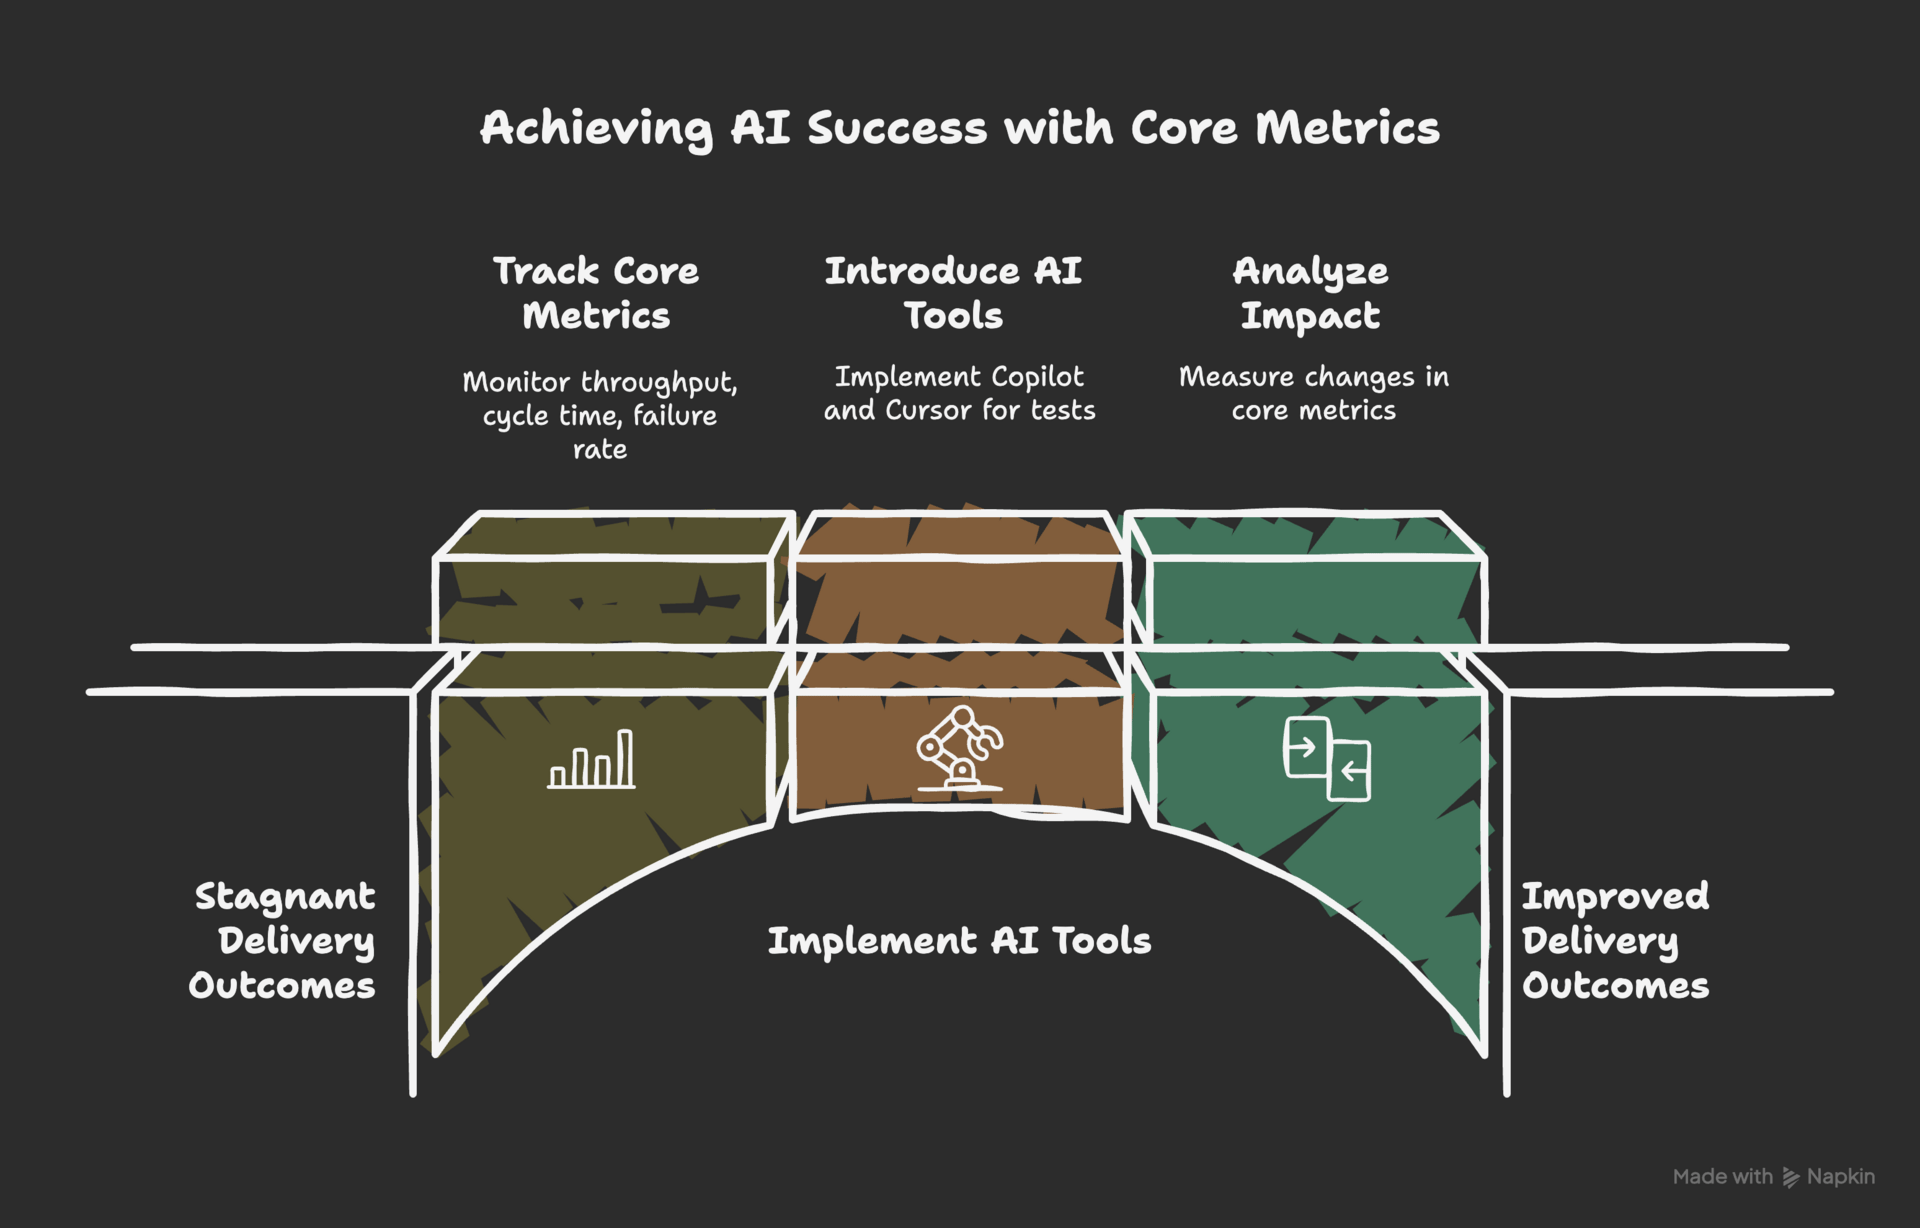
Core Metrics to Track:
PR Throughput: Are we shipping more code (merged PRs) per engineer?
PR Cycle Time: Are changes merging faster?
Change Failure Rate: Are we shipping fewer bugs or rollbacks?
Deployment Frequency: Are we delivering customer value more often?
You can capture all of this from your existing CI/CD and GitHub data.

Example:
A product team introduced GitHub Copilot and Cursor for test generation.
In 6 weeks, PR cycle time dropped from 3.4 → 2.7 days, while change failure rate stayed stable.
That’s real ROI — faster delivery, same quality.
💡 Pro Tip:
Always track speed and quality together — otherwise, you’ll optimize your way into technical debt.
Layer 2: Adoption — The Usage Lens
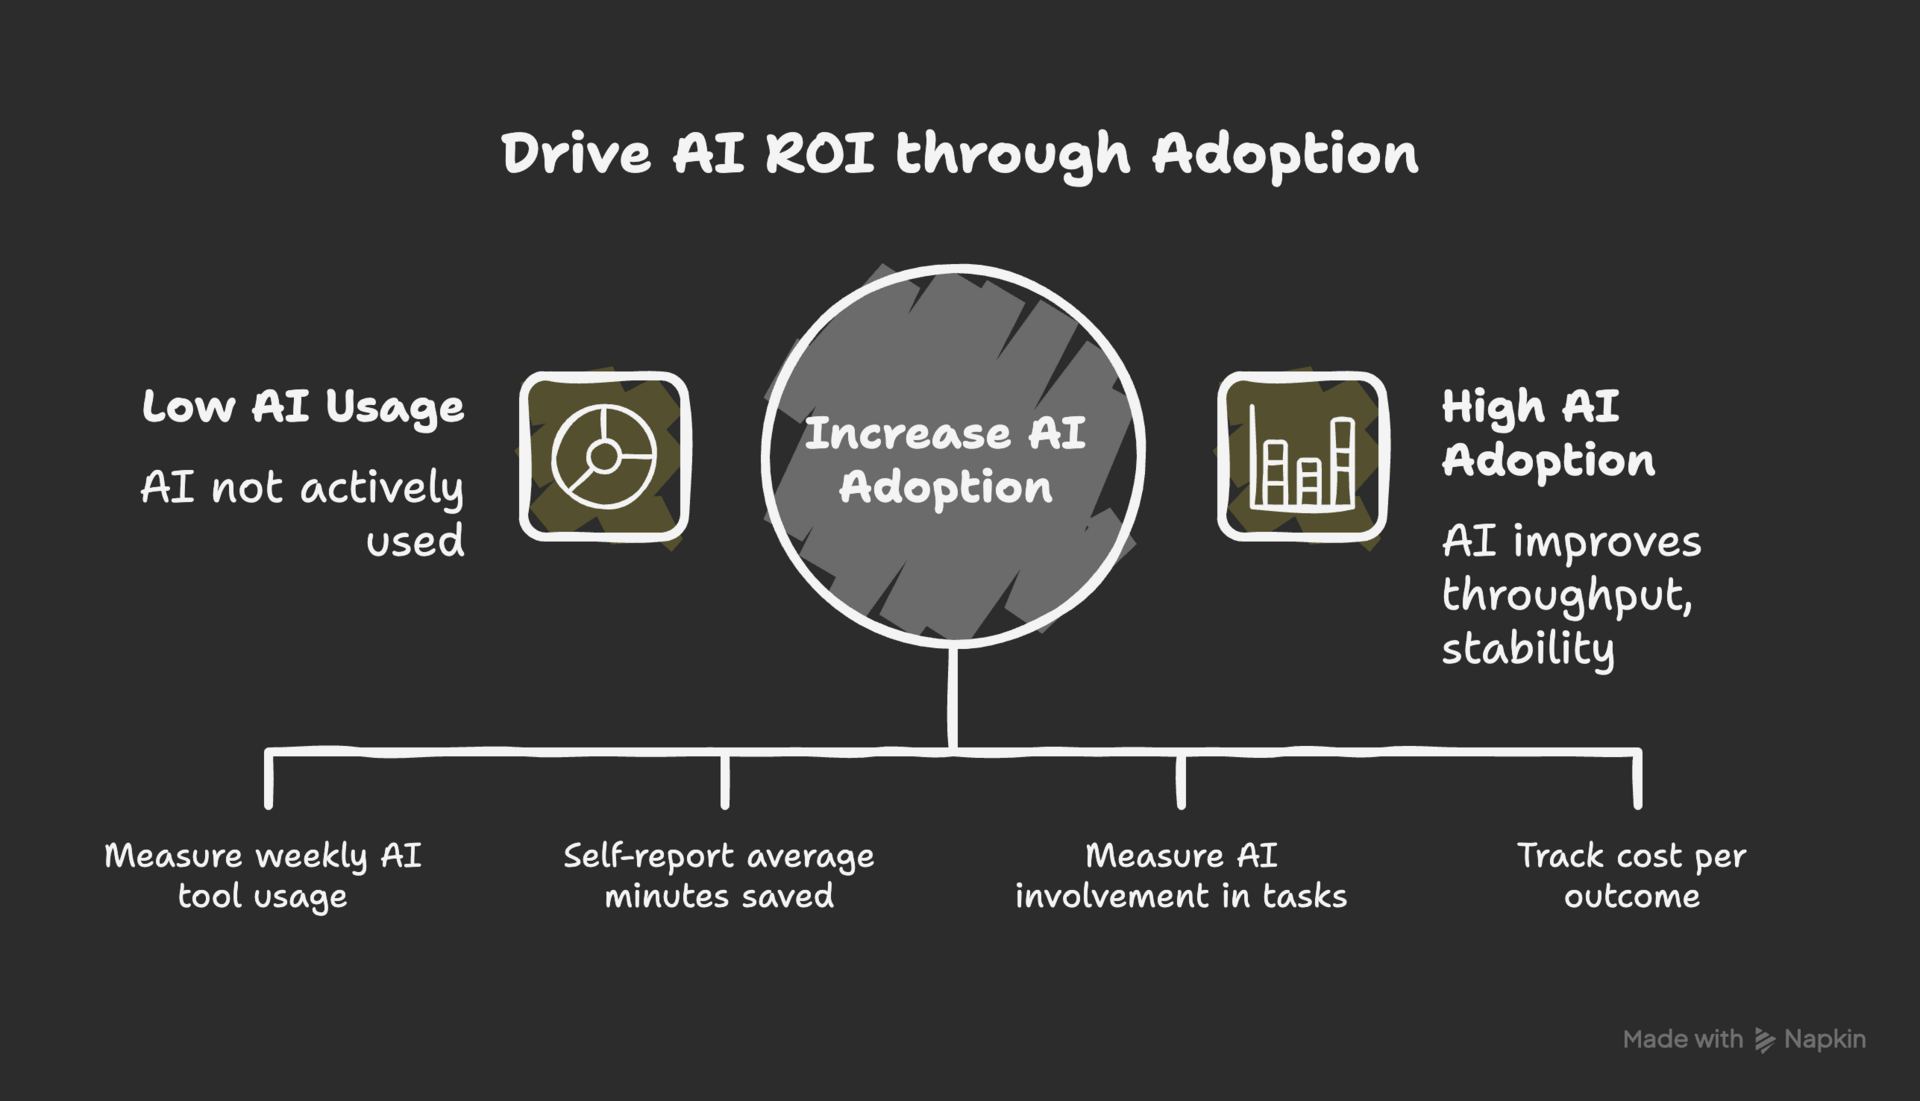
Next, measure whether AI is actually being used — and by whom.
AI ROI starts with adoption, but it’s meaningless without outcomes attached.
Adoption Metrics:
Active Users (%): % of engineers or employees using AI tools weekly
Time Saved (Self-Reported): Average minutes saved per week
AI-Touched Work (%): Share of tasks, PRs, or tickets that involved AI
AI Cost: Token spend, subscription cost, or compute used per outcome

Example:
Dropbox found 90% of its engineers used AI tools weekly.
Those users merged 20% more pull requests and reduced failure rates.
That’s the holy grail — adoption that improves throughput and stability.
💡 Pro Tip:
Don’t just measure “logins” — track meaningful usage. Was AI actually involved in producing deliverables (code, content, tests, etc.)?
Layer 3: Experience — The Human Lens
Here’s what most teams forget: ROI is sustainable only if the experience is positive.
Developers might ship faster with AI, but if they feel their work quality or comprehension is suffering, long-term productivity will collapse.
Experience Metrics:
AI-CSAT: Developer or user satisfaction with AI tools (1–5)
Change Confidence: “How confident are you that your last change won’t break production?”
Maintainability & Comprehension: “How easy is it to understand AI-written code?”
You can collect these via a short quarterly pulse survey or post-PR feedback form.
Example:
At Monzo Bank, engineers reported that AI helped them reduce “cognitive load” — making documentation and code comprehension easier.
Even when raw throughput stayed flat, developer satisfaction rose, improving retention and engagement.
💡 Pro Tip:
Balance quantitative metrics with qualitative feedback — what people feel about AI usage is often the leading indicator of what your data will later confirm.
🧭 Case Study: Measuring AI ROI in the Real World
Let’s make this tangible.
Imagine you’ve just implemented LeadFlow AI, an AI assistant that helps insurance brokers summarize WhatsApp leads and pre-fill CRM forms.
Here’s what your ROI measurement might look like after 45 days:
Metric | Before AI | After AI | ROI Signal |
|---|---|---|---|
Avg. Client Onboarding Time | 12 mins | 7 mins | ⬇️ 40% faster |
Leads Processed Weekly | 220 | 300 | ⬆️ 36% increase |
Escalations | 14 | 11 | ⬇️ 21% fewer |
Agent CSAT | 3.9 / 5 | 4.4 / 5 | ⬆️ +0.5 |
AI Spend / Month | — | $780 | ROI ≈ 2.5x |
That’s a 40% faster process, happier users, and a clear cost-per-impact ratio.
Now you can walk into a leadership meeting and prove your AI investment is working.
A word from our sponsor
The Simplest Way to Create and Launch AI Agents and Apps
You know that AI can help you automate your work, but you just don't know how to get started.
With Lindy, you can build AI agents and apps in minutes simply by describing what you want in plain English.
→ "Create a booking platform for my business."
→ "Automate my sales outreach."
→ "Create a weekly summary about each employee's performance and send it as an email."
From inbound lead qualification to AI-powered customer support and full-blown apps, Lindy has hundreds of agents that are ready to work for you 24/7/365.
Stop doing repetitive tasks manually. Let Lindy automate workflows, save time, and grow your business
🔍 How to Start Measuring AI Impact in 2 Weeks
You don’t need enterprise infrastructure — just a starting baseline.
Step 1 — Establish Your Pre-AI Baseline
Pull the last 8–12 weeks of metrics for your core outcomes:
PR throughput
PR cycle time
Change failure rate
CSAT or DevEx score
Freeze that data. That’s your “before.”
Step 2 — Add Lightweight AI Usage Signals
Add two fields to your PR template or task tracker:
[ ] Used AI to assist this workWhere did AI help/hurt? (optional)
That single checkbox gives you adoption data immediately.
Step 3 — Survey the Human Side
Send a quick 2-minute pulse (copy/paste):
How satisfied are you with our AI tools? (1–5)
How much time did AI save you last week? (minutes)
How confident are you that your last change won’t break production? (1–5)
Where did AI help most?
Where did AI slow you down?
Step 4 — Layer the Data
Combine:
System metrics (from Git, CI/CD)
AI usage data (from PR checkboxes, telemetry)
Human experience (from surveys)
Now you’ve got your three layers: Outcomes, Adoption, Experience.
Step 5 — Review Every 30 Days
Plot trend lines.
Is throughput up and failure rate stable? → ✅
Is satisfaction falling as speed rises? → ⚠️
Is token cost growing faster than impact? → 🛑
This “three-axis” approach is how high-performing teams make AI measurable — and defensible.
📊 The AI ROI Dashboard (Simple but Powerful)
You can build this in Notion, Sheets, or Retool in under an hour.
Category | Metrics | Frequency |
|---|---|---|
Outcomes | PR throughput, cycle time, failure rate | Weekly |
Adoption | AI usage %, time saved, cost per outcome | Weekly |
Experience | AI-CSAT, confidence, maintainability | Monthly |
Keep it visual, not verbose.
Executives don’t need 30 metrics — they need 3 that tell a story.
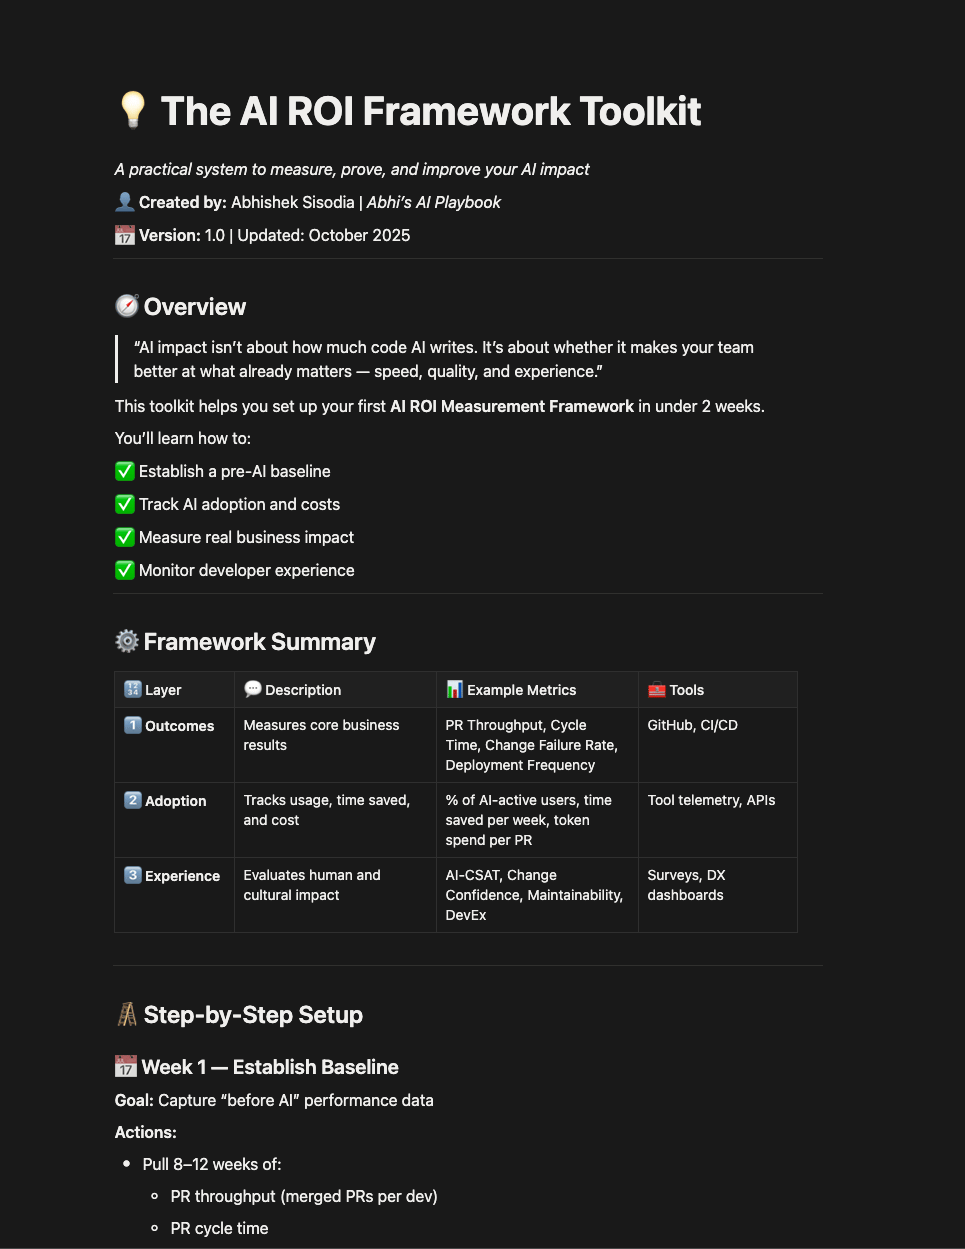
🧰 The Toolkit: Your AI ROI Framework (Free Template)
To make this simple, I put together a Notion version of the framework:

Baseline tracker template
Survey questions
Example dashboard
ROI calculator
👉 Subscribe below to unlock the full Notion Template and download instantly.
Already a subscriber? You’ll see the download link below 👇
New here? Hit subscribe, confirm your email, and come right back.
🧠 Pro Tip: Add newsletter email to your Safe Senders List so you never miss future guides and updates.


